Analysis
Navigating the Market: What 52 Week Lows and Highs Tell Investors

Trying to figure out where the stock market is headed can feel like a guessing game sometimes. But there are tools that can help make sense of it all. One simple way to get a feel for the market’s pulse is by looking at stocks that are hitting their 52 week lows and highs. These numbers might seem basic, but they actually tell a pretty interesting story about what’s happening with individual stocks and the market as a whole. Let’s break down what these yearly peaks and valleys can show us.
Key Takeaways
- The 52 week lows and highs show how a stock has performed over the past year and can hint at where it might go next.
- A stock’s 52-week high often acts like a ceiling, while its 52-week low can be a floor, helping investors decide when to buy or sell.
- When a stock breaks through its 52-week high or low, it can cause a lot of trading activity and big price changes, especially for smaller companies.
- Watching for patterns when stocks hit these yearly extremes can signal if a trend might be changing direction.
- Using these yearly price points helps set price targets for buying and selling and manage the risk of losing money.
Understanding 52 Week Highs and Lows
Defining the 52-Week High/Low Indicator
So, what exactly are these 52-week highs and lows everyone talks about? It’s pretty straightforward, really. For any given stock, it’s simply the highest and lowest price it has traded at over the past 52 weeks, which is about a year. Think of it as a stock’s yearly price range. This isn’t about the closing price necessarily, though that’s often what gets reported. Sometimes a stock might hit a new high during the trading day, but then pull back and close below that level. That intraday high might not count as an official "52-week high" in some reports, and failing to close at that new extreme can be a signal in itself. The same goes for lows. These numbers give us a snapshot of a stock’s performance over a full year, showing us the boundaries of its price movement.
Key Takeaways for Investors
What should you, as an investor, take away from these numbers? Well, a few things stand out:
- Price Boundaries: The 52-week high often acts like a ceiling, or resistance, where a stock might struggle to go higher. Conversely, the 52-week low can be a floor, or support, where buying interest might pick up.
- Momentum Clues: When a stock breaks through its 52-week high, it can suggest strong buying interest and potentially more upward movement. The opposite can happen if it falls below its 52-week low.
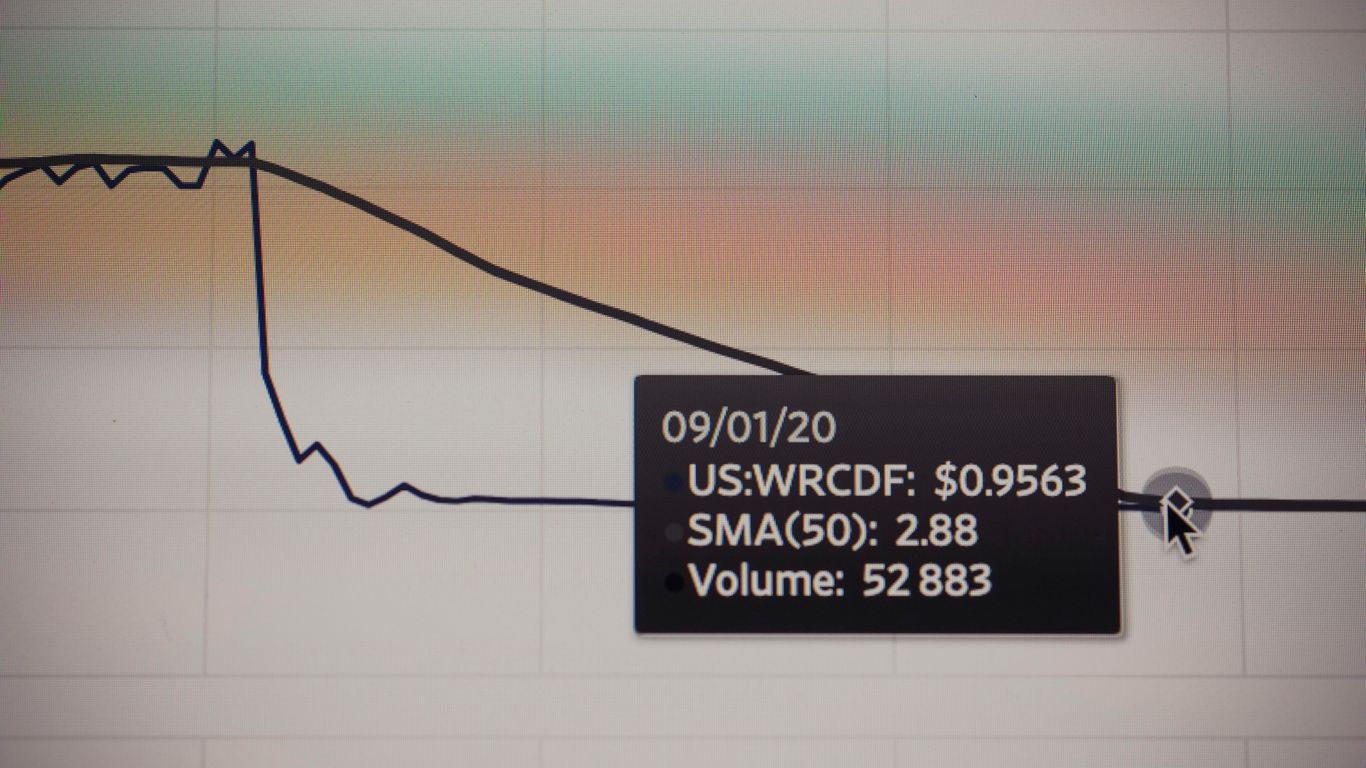
- Volume Matters: Watch what happens to trading volume when a stock hits these extremes. A big jump in volume as a stock reaches a 52-week high or low can really emphasize the importance of that price level.
- Small vs. Large Caps: These levels seem to have a bigger immediate impact on smaller companies (small-cap stocks) compared to the big, established ones (large-cap stocks), especially when they first cross these yearly boundaries.
The Role in Trading Decisions
These 52-week markers aren’t just for looking back; they actively influence how people trade. Many traders use these levels to decide when to buy or sell. For instance, if a stock is climbing and looks like it might break its 52-week high, some traders will jump in, expecting the price to keep going up. They might set orders to automatically buy if the price goes above that high. Similarly, if a stock is falling and approaches its 52-week low, some might see it as a buying opportunity, or others might sell to avoid further losses, perhaps setting an order to sell if the price drops below that low. It’s all about using these historical price points as potential triggers for future action, often with the idea that a break of these levels means the price will continue moving in that new direction.
Leveraging 52 Week Highs for Strength
When a stock hits its 52-week high, it’s often a sign that something good is happening. Think of it like a runner hitting their stride – they’ve overcome past challenges and are now moving forward with real power. This isn’t just random luck; it usually means a lot of people, including big money managers, are buying in. They see something in the company that makes them confident about its future. This kind of buying pressure can keep pushing the stock price up.
So, how do you spot these strong performers? It’s about looking for stocks that are not just inching up, but are actively climbing towards or breaking through their yearly price ceiling. This often happens when a company has been performing well, maybe after a period of struggle, and investors are taking notice. It’s like the market is saying, "This one’s got potential!"
Identifying Momentum and Upward Trends
Stocks reaching their 52-week highs are often in an uptrend. This means the price has been generally increasing over time, and hitting a new high suggests that momentum is still strong. It’s a signal that the positive forces driving the stock are still in play. You can often see this on a chart as a series of higher highs and higher lows. It’s not just about the single high point, but the overall direction the stock has been moving.
The ‘Smart Money’ Indicator
When a stock starts hitting new highs, especially after a period of being overlooked, it’s a good clue that institutional investors – the big players like mutual funds and hedge funds – are getting involved. These are the folks with deep pockets and research teams. If they’re buying, it’s often because they’ve done their homework and believe the stock has more room to grow. Following their lead can be a smart move, as they often have a better view of where the market is headed.
Strategies for Stocks at 52 Week Highs
What do you do when you see a stock at its 52-week high? Here are a few ideas:
- Look for confirmation: Don’t just buy because it’s high. Check if the price is breaking through the high with strong trading volume. This shows a lot of interest and conviction.
- Consider the trend: Is the stock part of a sector that’s generally doing well? If so, it might have more upside. A stock hitting a high in a weak sector might be less convincing.
- Watch for pullbacks: Sometimes, after hitting a high, a stock might dip a little before continuing its climb. Buying on these small dips can be a good way to get in at a slightly better price while still riding the upward trend.
- Don’t chase: If a stock has already shot up way past its 52-week high without you, it might be too late to jump in. It’s often better to find the next one that’s just starting its climb.
Interpreting 52 Week Lows for Weakness
So, we’ve talked about the highs, but what about the other end of the spectrum – the 52-week lows? Looking at stocks hitting their lowest points over the past year can give you a real sense of where the market might be struggling. It’s like looking for cracks in the foundation; you want to know where the weakness is before it causes bigger problems.
Gauging Selling Pressure in the Market
When a lot of stocks start hitting new 52-week lows, it’s a pretty clear signal that there’s a good amount of selling going on. Think of it as a crowd of people all trying to leave a room through the same small door at once. It tells you something’s making people nervous. We’re not just talking about one or two stocks here; it’s when you see a consistent, high number of companies reaching these low points day after day. This kind of widespread selling pressure can really drag the whole market down, even if some of the big, well-known stocks are still holding up okay for a bit.
Locating Areas of Market Weakness
Just looking at the total number of stocks hitting lows is useful, but you can get even more specific. By checking which sectors or industries have the most companies at their 52-week lows, you can pinpoint exactly where the trouble spots are. For example, if you see a bunch of tech companies all hitting new lows, it might suggest there’s a problem specifically within that sector, rather than with the market as a whole. This helps you avoid getting caught in a broad market downturn by steering clear of these weaker areas.
The Significance of the 40-Low Threshold
There’s a bit of a rule of thumb that many experienced investors watch, and it’s called the "40-low threshold." Basically, if you see more than 40 stocks hitting new 52-week lows on any given day, it’s often seen as a sign that the market is under some stress. When this number stays above 40 for several days in a row, it’s a stronger indication that selling pressure is significant and widespread. It doesn’t necessarily mean the market is going to crash, but it’s a good cue to be cautious. If the number of new lows drops below 40 consistently, and the number of new highs starts to increase, that’s usually a sign that things are starting to improve and the selling pressure is easing up.
The Psychology and Impact of Breaching Barriers
Psychological Barriers at 52 Week Highs
It’s funny how our brains work, right? When a stock hits a new 52-week high, it can feel like a big deal, almost like a wall. Most investors get a bit hesitant, thinking, ‘Should I really buy something that’s already gone up so much?’ It’s like we’re wired to think ‘buy low, sell high,’ and this feels like the opposite. This hesitation can actually create a sort of psychological barrier. Even if there’s good news, people might hold back, and this underreaction can sometimes let the price keep climbing slowly as the market catches up. It’s a weird dance between what the stock is actually doing and what people think it should be doing. This is where understanding support and resistance levels becomes really interesting, as these psychological points often align with technical levels.
Volume Spikes and Price Moves
When a stock does break through that 52-week high or low, something interesting often happens: the trading volume can really pick up. It’s like the barrier breaking causes a stir. Studies have shown that when smaller stocks cross their 52-week highs, they can see a noticeable jump in gains shortly after. For bigger companies, the effect might take a bit longer to show up, but it’s still there. This surge in activity isn’t just random; it often signals that more money is flowing into the stock, pushing the price further.
Here’s a quick look at what some research has suggested:
- Small-cap stocks breaking 52-week highs saw about 0.63% in excess gains the following week.
- Large-cap stocks breaking 52-week highs saw about 0.18% in excess gains the following week.
- Over time, the impact of these highs and lows became more noticeable for larger stocks.
Impact on Small-Cap vs. Large-Cap Stocks
So, does this barrier-breaking thing affect all stocks the same way? Not exactly. While both small and large companies can see increased activity when they hit new highs or lows, the immediate impact seems to be more pronounced in smaller companies. Think of it like a ripple effect – a smaller pond might show bigger waves from the same splash compared to a huge lake. However, the long-term influence of these price extremes tends to grow for the bigger players in the market. It’s a dynamic that investors need to keep an eye on, as it can influence how quickly a stock reacts and for how long.
Recognizing Reversal Patterns at Extremes
Sometimes, a stock hitting a 52-week high or low isn’t just a milestone; it can be a sign that things are about to change. Think of it like a runner hitting their absolute peak speed – they can’t just keep going faster forever, right? The same idea applies to stock prices.
Identifying Potential Tops at 52 Week Highs
When a stock reaches its 52-week high, it’s often a moment of celebration for investors. But this is also when professional traders and institutions might start thinking about taking profits. They’ve seen the price climb, and they want to lock in their gains before anything goes wrong. This can lead to a pullback. A common signal that a top might be forming is when a stock hits a new high during the day but then sells off, closing much lower than it opened. This can look like a "shooting star" candlestick pattern on a daily chart. It’s basically the market saying, "We tried to go higher, but we couldn’t hold it."
- Profit-Taking: Big players often set orders to sell when a stock hits a certain price, like its 52-week high.
- Psychological Resistance: The 52-week high becomes a mental barrier for some investors, making them hesitant to buy more.
- Overbought Signals: Technical indicators might show the stock has gone up too far, too fast, suggesting a correction is due.
Spotting Potential Bottoms at 52 Week Lows
On the flip side, a 52-week low can be a sign of distress, but it can also signal a turning point. If a stock plummets to a new low for the year but then manages to rally back significantly before the day ends, it might be finding support. This can sometimes form a "hammer" candlestick pattern. It’s like the stock saying, "Okay, we went down, but buyers stepped in and pushed us back up." This can attract bargain hunters looking for a good deal or short-sellers who bet on the price falling, now buying back shares to close their positions.
- Bargain Hunting: Investors see a low price as an opportunity to buy shares they believe are undervalued.
- Short Covering: Traders who bet against the stock might buy shares to limit their losses, adding buying pressure.
- Support Levels: The low point might act as a floor, where buying interest consistently appears.
The Role of Candlestick Patterns
Candlestick charts are super useful here. They give us a visual story of what happened during a trading day. A shooting star at a 52-week high, with a long upper wick and a small body near the bottom, shows a failed attempt to move higher. Conversely, a hammer at a 52-week low, with a long lower wick and a small body near the top, indicates that selling pressure was overcome by buying pressure. These patterns, when they appear at these extreme price points, can give us clues about whether the trend is likely to continue or reverse. It’s not a guarantee, of course, but it’s another piece of the puzzle for making informed decisions.
Practical Application of 52 Week Highs and Lows
So, you’ve got these 52-week high and low numbers. What do you actually do with them? It’s not just about knowing the numbers; it’s about using them to make smarter moves in the market. Think of them as signposts, telling you where a stock has been and potentially where it might go next.
Setting Support and Resistance Levels
These yearly extremes are really good at showing us where a stock might have trouble breaking through. The 52-week high often acts like a ceiling, a point where selling might kick in. Conversely, the 52-week low can be like a floor, a level where buyers might step in. It’s not a guarantee, of course, but it’s a strong hint.
- Resistance: When a stock hits its 52-week high, it’s a signal that many people who bought it at lower prices might be looking to sell and take their profits. This can create a barrier, making it harder for the price to climb higher.
- Support: On the flip side, when a stock drops to its 52-week low, it can attract bargain hunters. People see it as a cheaper price and might start buying, which can stop the price from falling further.
- Breaking Through: If a stock really smashes through its 52-week high with a lot of buying activity, it can suggest strong upward momentum. The opposite is true if it breaks below its 52-week low – it might keep falling.
Using Highs and Lows for Entry and Exit Points
This is where things get really practical. You can use these levels to decide when to get into a stock or when to get out. For instance, some traders like to buy a stock when it breaks above its 52-week high, betting that the momentum will continue. They might see this as a sign that the stock is starting a new upward move.
On the other hand, if a stock is falling and breaks below its 52-week low, some traders might see that as a signal to sell, either to cut their losses or to bet on the price going down further. It’s all about timing your moves based on these key price points.
Managing Risk with Stop-Loss and Take-Profit Orders
This is super important for not losing too much money. You can set automatic orders based on these 52-week levels. A stop-loss order is like an insurance policy. If a stock you own starts falling and hits a certain price (maybe its 52-week low, or a bit below it), your shares are automatically sold to prevent bigger losses. This helps you control how much you could potentially lose on any single trade.
Take-profit orders work the other way. If a stock you bought goes up and hits a price you’re happy with (maybe near its 52-week high, or a bit above it), you can set an order to sell it automatically. This way, you lock in your profits before the price potentially turns around. Using these orders takes some of the emotion out of trading and helps you stick to your plan.
Wrapping It Up
So, looking at the 52-week highs and lows isn’t just about tracking numbers. It gives you a peek into what’s happening under the hood of the market. Highs can show you where the momentum is, suggesting that some stocks are really catching on. On the flip side, lows can point out where the trouble spots are, helping you avoid getting caught in a downturn. It’s not a magic crystal ball, of course, but using these simple markers can really help you make smarter choices with your investments. Keep an eye on these numbers, and you’ll be better equipped to handle whatever the market throws your way.


ETHRA AI Reports Strong Early Momentum as Stage 1 Presale Reaches 11% Completion

Understanding Comparative Negligence in Jacksonville Personal Injury Cases

LiquidWhales Goes Live: The First Hyperliquid Whale Tracker That Grades Every Wallet Net of Fees — and Lets You Copy the Winners in One Click

SolForger Launches as a Non-Custodial Solana Developer Platform for Builders, Creators, and On-Chain Projects

Securing the Future: Jayen Consulting Officially Migrates to a New Digital Domain

Focusing on Compliance, Truoux Advances MAS License Application

Truoux Advances UK FCA License Application, Deepens Compliance Strategic Layout

Truoux Optimizes Risk Control and AML Systems, Accelerating the RMO and DAX License Application Process

Rovum Builds Momentum in On-Chain Settlement Markets

Is Professional Mold Testing Worth It?

Why Small Shipping Boxes Are Becoming the Default for 25-unit Trial Runs

Radio Ads and Personal Spending: Where Prosecutors Allege the Dynamic Money Millions Went

The $34 Million Deception: Where the Guam Charity Bingo Money Really Went

Celeste White’s Influence on Sustainable Agricultural Practices in Napa Valley

Inside the 12-Count Federal Indictment Against Fugitive Darren Anthony Robinson

-
 Press Release7 days ago
LiquidWhales Goes Live: The First Hyperliquid Whale Tracker That Grades Every Wallet Net of Fees — and Lets You Copy the Winners in One Click
-
 Business4 days ago
Understanding Comparative Negligence in Jacksonville Personal Injury Cases
-
 Press Release3 days ago
ETHRA AI Reports Strong Early Momentum as Stage 1 Presale Reaches 11% Completion