Digital Marketing
Measuring user engagement – Three ways to track mobile app engagement
Does this curve look familiar?
If you’ve recently launched a new app, there is a good chance you have seen this curve before. This curve is typically seen on the dashboards of mobile app analytics tools when marketers are studying app downloads.
The diagram above is also known as the shark-fin curve. In the case of mobile apps, it shows the total active users over a period of time.
Why do active app users generally follow this curve? A little understanding of the mobile app market would help readers understand this trend.
In week one, app marketers are still trying to shore up their app visibility. Thus, the downloads remain stuck at a small base. The following weeks see an impressive rise as the app’s visibility increases. Perhaps someone working at a popular tech magazine finds the app and writes a piece about it.
And then starts the fall. Active users start dwindling as the visibility stagnates and user engagement declines. App companies are stuck with two options in this case, acquire new users to again shore up active users or retain the ones who remain.
This decline happens for one simple reason – fall in engagement. Figuring out a way to shore up user engagement is the greatest challenge in the app market currently. There is a whole set of designated techniques like push notifications, gamification, user flow improvement, and so on.
Which one works better for which app?
First, it is important to learn how to measure user engagement. This piece discusses three main ways to measure and analyze user engagement in mobile apps.
User engagement rate – A simple formula
User engagement covers practically everything a user does on an app. It would thus appear that calculating user engagement is a tedious task.
Thankfully, app analysts use a very simple formula to calculate user engagement.
User engagement rate = Total active users / Total users
The same formula can be applied to calculating the specific engagement rate of different cohorts. The average rate of mobile app engagement is generally around 29% over a period of three months.
This same formula can be extrapolated to calculating different types of user engagement. The following cover three different ways to measure and analyze user engagement.
#1 – Time-based engagement
Time-based engagement simply means calculating engagement over different periods of time.
Let’s assume you build your own app to sell airline tickets. Even your most loyal users won’t open your app every day. You provide a service to people looking to book flight tickets. In general, people are not looking to fly somewhere every day.
Thus, calculating user engagement on a day-by-day basis is non-productive. It makes more sense to calculate monthly and quarterly engagement rates.
Thus, user engagement analysis also plays a key role in getting smart insights. An ecommerce app selling essential home hardware products will have a lower engagement rate on a daily basis compared to a food delivery app. This is because the latter is delivery products which have a shorter life cycle.
Understand what your app offers and analyse the engagement rate based on the same.
#2 – Feature-based engagement
Feature-based engagement helps you see whether people who use a particular feature on an app tend to engage more.
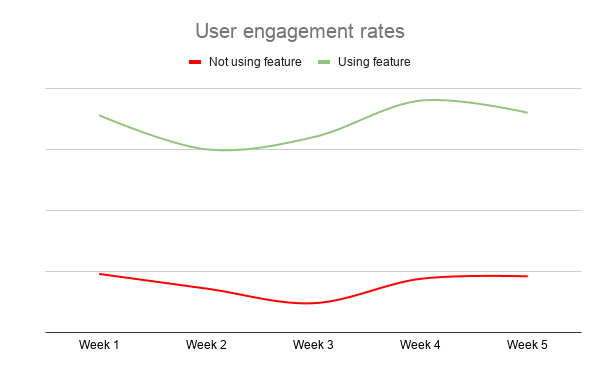
Take a look at the following graph.
The graph above provides an insight into user engagement rates. The green line shows the engagement rates of app users who use a particular feature. The red line shows the engagement rate of users who don’t use the same feature.
What does this tell you? Even a novice at data analysis would correctly infer that the feature is contributing to user engagement. The goal of the company running the app should thus be to promote this feature as much as they can.
User engagement comparison based on features can help analysts understand user behaviour at a more deeper level. While the formula of calculating the engagement rate is still the same, comparing different rates helps shed light on the impact of specific features.
This is important in the long run to study the success or failure of a new feature.
#3 – Channel-wise engagement
Channel-wise engagement helps analysts see which user acquisition segment ends up engaging the most.
Let’s assume you go from WooCommerce to mobile app for Android and iOS to make your own ecommerce app. You’re promoting your app on various marketing channels. To refine your marketing efforts, you wish to compare engagement data of users acquired from different channels.
If users coming from Facebook have a better engagement rate than those coming from LinkedIn, it makes sense to focus more on the former. Channel-wise engagement analysis is generally most useful for market research.
Marketers often feel the choice of audience is a stab in the dark. This form of engagement analysis shows marketers the exact channel which brings the most valuable app users. This data can be used to refine Facebook CBO campaigns, organic funnels, and even app store optimization efforts.
In conclusion
All apps need engagement. From those who build an app from scratch using code to those who use app builders to convert WordPress website to Android app, engagement is the bread and butter for long-term app success.
The piece discusses the practice of measuring app engagement. The various sections reveal three different ways to track user engagement. Each provides its own unique set of benefits.


ETHRA AI Reports Strong Early Momentum as Stage 1 Presale Reaches 11% Completion

Understanding Comparative Negligence in Jacksonville Personal Injury Cases

LiquidWhales Goes Live: The First Hyperliquid Whale Tracker That Grades Every Wallet Net of Fees — and Lets You Copy the Winners in One Click

SolForger Launches as a Non-Custodial Solana Developer Platform for Builders, Creators, and On-Chain Projects

Securing the Future: Jayen Consulting Officially Migrates to a New Digital Domain

Focusing on Compliance, Truoux Advances MAS License Application

Truoux Advances UK FCA License Application, Deepens Compliance Strategic Layout

Truoux Optimizes Risk Control and AML Systems, Accelerating the RMO and DAX License Application Process

Rovum Builds Momentum in On-Chain Settlement Markets

Is Professional Mold Testing Worth It?

Why Small Shipping Boxes Are Becoming the Default for 25-unit Trial Runs

Radio Ads and Personal Spending: Where Prosecutors Allege the Dynamic Money Millions Went

The $34 Million Deception: Where the Guam Charity Bingo Money Really Went

Celeste White’s Influence on Sustainable Agricultural Practices in Napa Valley

Inside the 12-Count Federal Indictment Against Fugitive Darren Anthony Robinson

-
 Business3 days ago
Understanding Comparative Negligence in Jacksonville Personal Injury Cases
-
 Press Release6 days ago
LiquidWhales Goes Live: The First Hyperliquid Whale Tracker That Grades Every Wallet Net of Fees — and Lets You Copy the Winners in One Click
-
 Press Release3 days ago
ETHRA AI Reports Strong Early Momentum as Stage 1 Presale Reaches 11% Completion